There are some important functions that are worth remembering in calculus. These relations play a vital role in calculus and are discussed here.
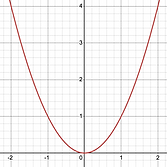
1: Quadratic Relation
The most basic quadratic relationship is written in the form
In this equation, the y-values grow at a faster pace than the x-values and the points form a symmetric
relationship about the y-axis. Here is a sketch of its graph.
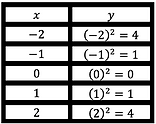
Tip: I have been asked by some students how to memorize the shape of graphs like the one above.
My answer is to create a table of values. You can quickly make one for any relationship if you forget.
Here is a table of values for the quadratic function.
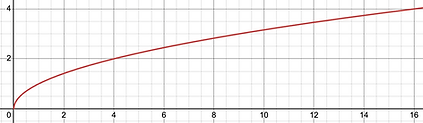
2: Square Root Relation
The most basic square root relationship is written in the form
In this equation, the y-values grow at a slower pace than the x-values and the points form a half-parabola on the right-side of the x-axis. The input x cannot be negative for the function to exist.
When making a table of values to create points for this relationship, you want to start at x = 0 and
then use other x-values whose square root are whole numbers, such as 1, 4, 9, 16.
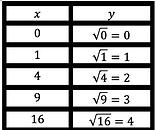
When connecting the 5 key points above on a graph we get this picture:
3: Cubic Relation
The most basic quadratic relationship is written in the form
When x is greater than or equal to 0, the cubic relation has the property that the y-values increase at a faster pace than the x-values, similar to a quadratic relation. The difference though is that the changes in y are higher than they are in the quadratic equation. Unlike the quadratic relation, the graph is
symmetric about the origin. Negative values of x produce negative values of y and positive values of x
produce positive y-values. Here is a table of values along with a sketch of the key points.


4. Exponential Relation
A basic exponential relation has the form
An exponential relation has several unique properties. One of these properties is that the y-values are positive for any real number x. Furthermore, as x-values become more negative the y-values will approach 0 and we call this its horizontal asymptote (y=0)
Another important property is that the y-values will increase at a very fast pace when the
base used is greater than 1, and decrease at a very fast pace when the base used is less than one.
Again, here is a table of values to create 5 key points and the corresponding graph.


To better appreciate the rapid increase in y-values we would need to extend the table to large x-value. For instance, 2 to the power of 3 is 8, 2 to the power of 4 is 16, and 2 to the power of 5 is 32. So the increases in y are 8 to 16 to 32, doubling each time.
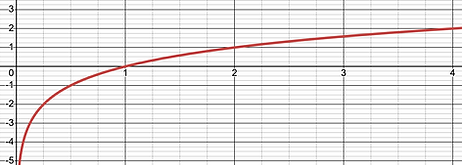
5. Logarithmic Relation
A basic logarithmic relation has the form
A logarithmic relation is an inverse to an exponential relation, meaning that the x and y coordinates are interchanged from a known exponential relation to form the points on the graph of a logarithmic relation. Because of this change the horizontal asymptote (y=0) becomes a vertical asymptote (x=0), meaning the the points can get close to x = 0 but never reach it. also has several unique properties.
To sketch the graph of the logarithmic function I am going to use the points I made
above for its inverse relation, which is